Summary
Water samples are collected infrequently at most sites, and for many sites years can go by with no samples analyzed for nutrient pollution. There are limited periods of time when samples are collected at a consistent set of sites, allowing for comparisons to be made.
Method
1. We downloaded Hawaii DOH data from Storet for the island of Maui for all available years. http://emdweb.doh.hawaii.gov/CleanWaterBranch/WaterQualityData/default.aspx
2. We sorted the data by collection site and then by sample date. The overall dates of this study were November 1, 2004 to October 31, 2015.
3. We grouped the data into one-month periods, with the first period beginning on November 1, 2004 and ending on November 30, 2004.
4. We then partitioned the data into seasonal groups, one for the wet months, November through April, and one for the dry months, May through October.
5. Within the seasonal groups we tallied the number of samples for the reported water quality (WQ) values.
Results and Discussion
Table A1 shows the number of samples by month over the 11 year period of study. Turbidity samples range from 224 to 365 per month, while the other water quality variables range from 22 to 88 and are generally consistent with each other on a month by month basis.
Table A1. The number of samples collected by month over the period November 1, 2004 to October 31, 2015.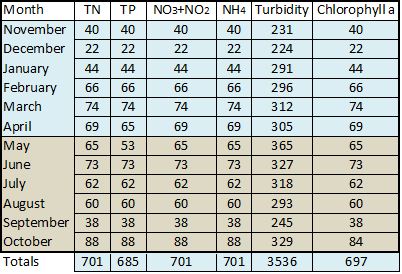
Table A2 summarizes the total number of samples for each variable at each site. The least sampled sites were Kamaole Beach #1, Hanakoo, Kalama Beach, Cove Park, and Black Rock having counts in the 30s for most variables. The most frequently sampled site was Kihei South with sample counts in the high 80s for most variables. Kahekili Airport Beach and Honolua Bay were the next most frequently sampled site with counts in the 60s. It is interesting to note that Cove Park and Kihei South were respectively the least and most frequently sampled of the fourteen study sites and that this is the case subsequent to the identification of Cove Park and Kalama Beach as being in the epicenter of the Kihei WWRF effluent plume [1].
Table A2. The number of samples collected by site over the period November 1, 2004 to October 31, 2015.
Figure A1 shows the number of TN samples collected by month at each of the study sites. After 2010 there were only eight sites where TN and the other water quality variables were sampled. Those eight sights were used for the Geometric Mean study. It is noteworthy to mention that in 2015 none of the South Maui sites were measured for TN.
Figure A1. The number of TN water samples by month for each site. Each tic mark on the vertical axis represents a single sample per month. In general, if a site is sampled for TN it is usually sampled for the other water quality variables, so this chart can be taken as representative of the frequency distribution for the other variables as well. The largest number of samples in any month was five.
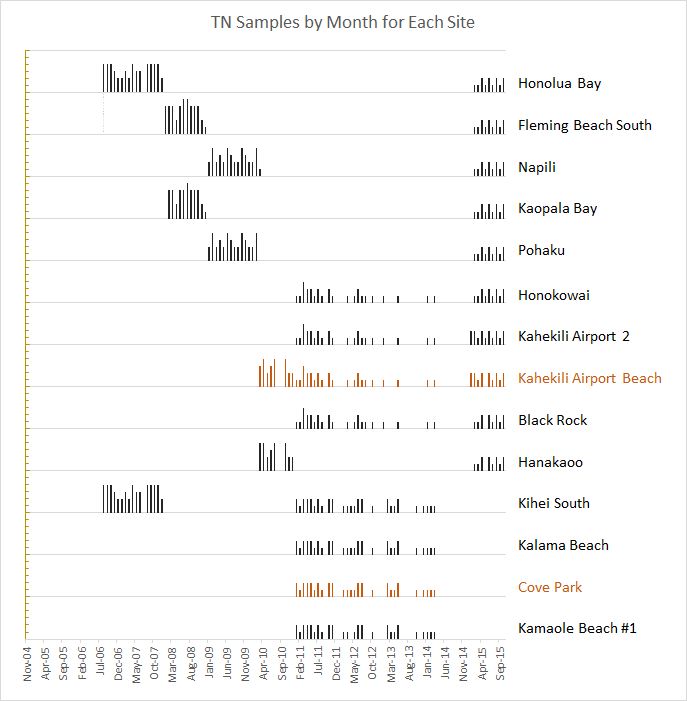 From November 2004 to August 2006 the only samples collected at any site were for turbidity. In August 2006 samples began to be collected at Honolua Bay and Kihei South for the other water quality variables, TN, TP, NO3+NO2, NH4, and Chlorophyll a. In January 2008 samples began to be collected at Fleming Beach South, and in February 2008 at Kaopala Bay.
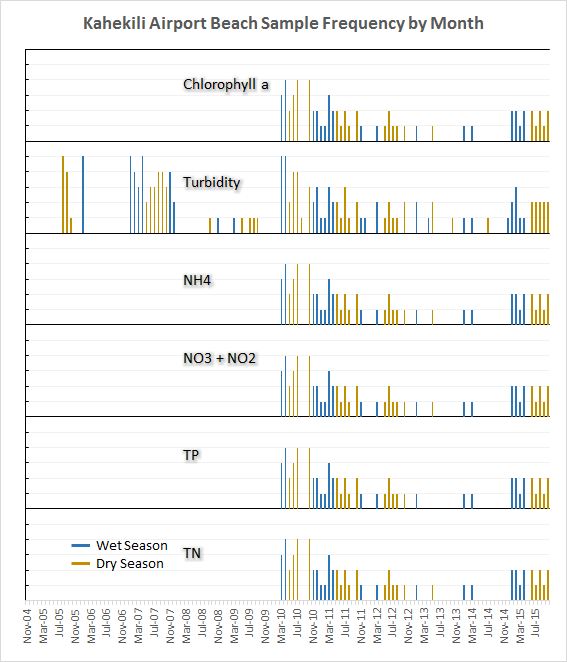
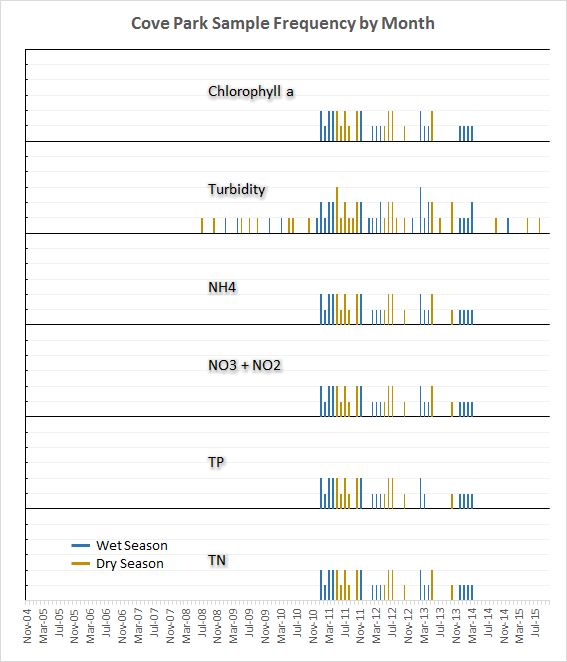
In general for all sites, if a water sample is analyzed for TN then it is analyzed for the other variables as well. Figures A2a and A2b are histograms of the number of samples collected per month over the study period at the two sites closest to their respective WWRF. Prior to January 2010 only turbidity samples were collected. In 2010 and 2011 more samples were taken than in the years 2012, 2013, and 2014. Sampling increased again in 2015 but only for the West Maui sites.
Figure A2a-b. The number of water samples per month for the sites closest to their respective WWRF. Each tic mark on the vertical axis represents a single sample per month. Blue bars indicate months in the wet season (November through April) and tan bars indicate months in the dry season (May through October). The largest number of samples in any month was five for turbidity at Kahekili Airport Beach, which happened on six occasions (August 2005, January 2006, January 2007, April 2007, March 2010, and April 2010).
Temporal Dataset
This spreadsheet contains the data used for Figure A1. For each site, it shows the number of water samples per month for each pollutant. The sample sheet displayed below shows only the first several rows of the 7,488 rows of data; click into the spreadsheet for the complete dataset.