Frequency of Water Sampling
The data available for analysis spans a period of over 42 years, and was collected from 82 sites around Maui. Our Metadata page has more information about the 18,000+ records we analyzed. Over the 513 months of this study, the number of water samples collected per site varies from less than 10 to more than 1000. The Site Totals spreadsheet shows the number of times that each of the pollutants were measured. It also shows the number of times the microbial content was measured for two indicator organisms.
Site Totals Map and Spreadsheet
View Sample Counts in a full screen map. You can select the desired map layer using the popup in the lower left hand corner of the interactive map.
Site Totals sortable spreadsheet link
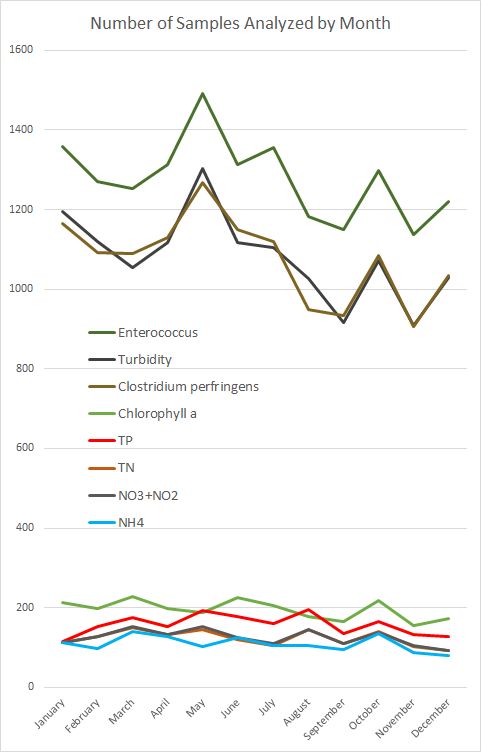
Monthly Totals Chart and Spreadsheet
Turbidity and the microbes are measured most frequently, often by a factor of 7 to 10 times as often compared to the other pollutants.
Counts per Month Spreadsheet
Looking at the number of samples collected per month (per site), we can see that the vast majority of the time only a single sample is collected if the site is visited at all. Interestingly, if more than one turbidity measurement is taken per month it is likely to be measured 7 or 8 times. These numbers correlate well with the microbial assays and suggests these are done during periods of concern.
Monthly Per Site
Monthly per Site sortable spreadsheet link 7488 rows, click into spreadsheet for complete data.
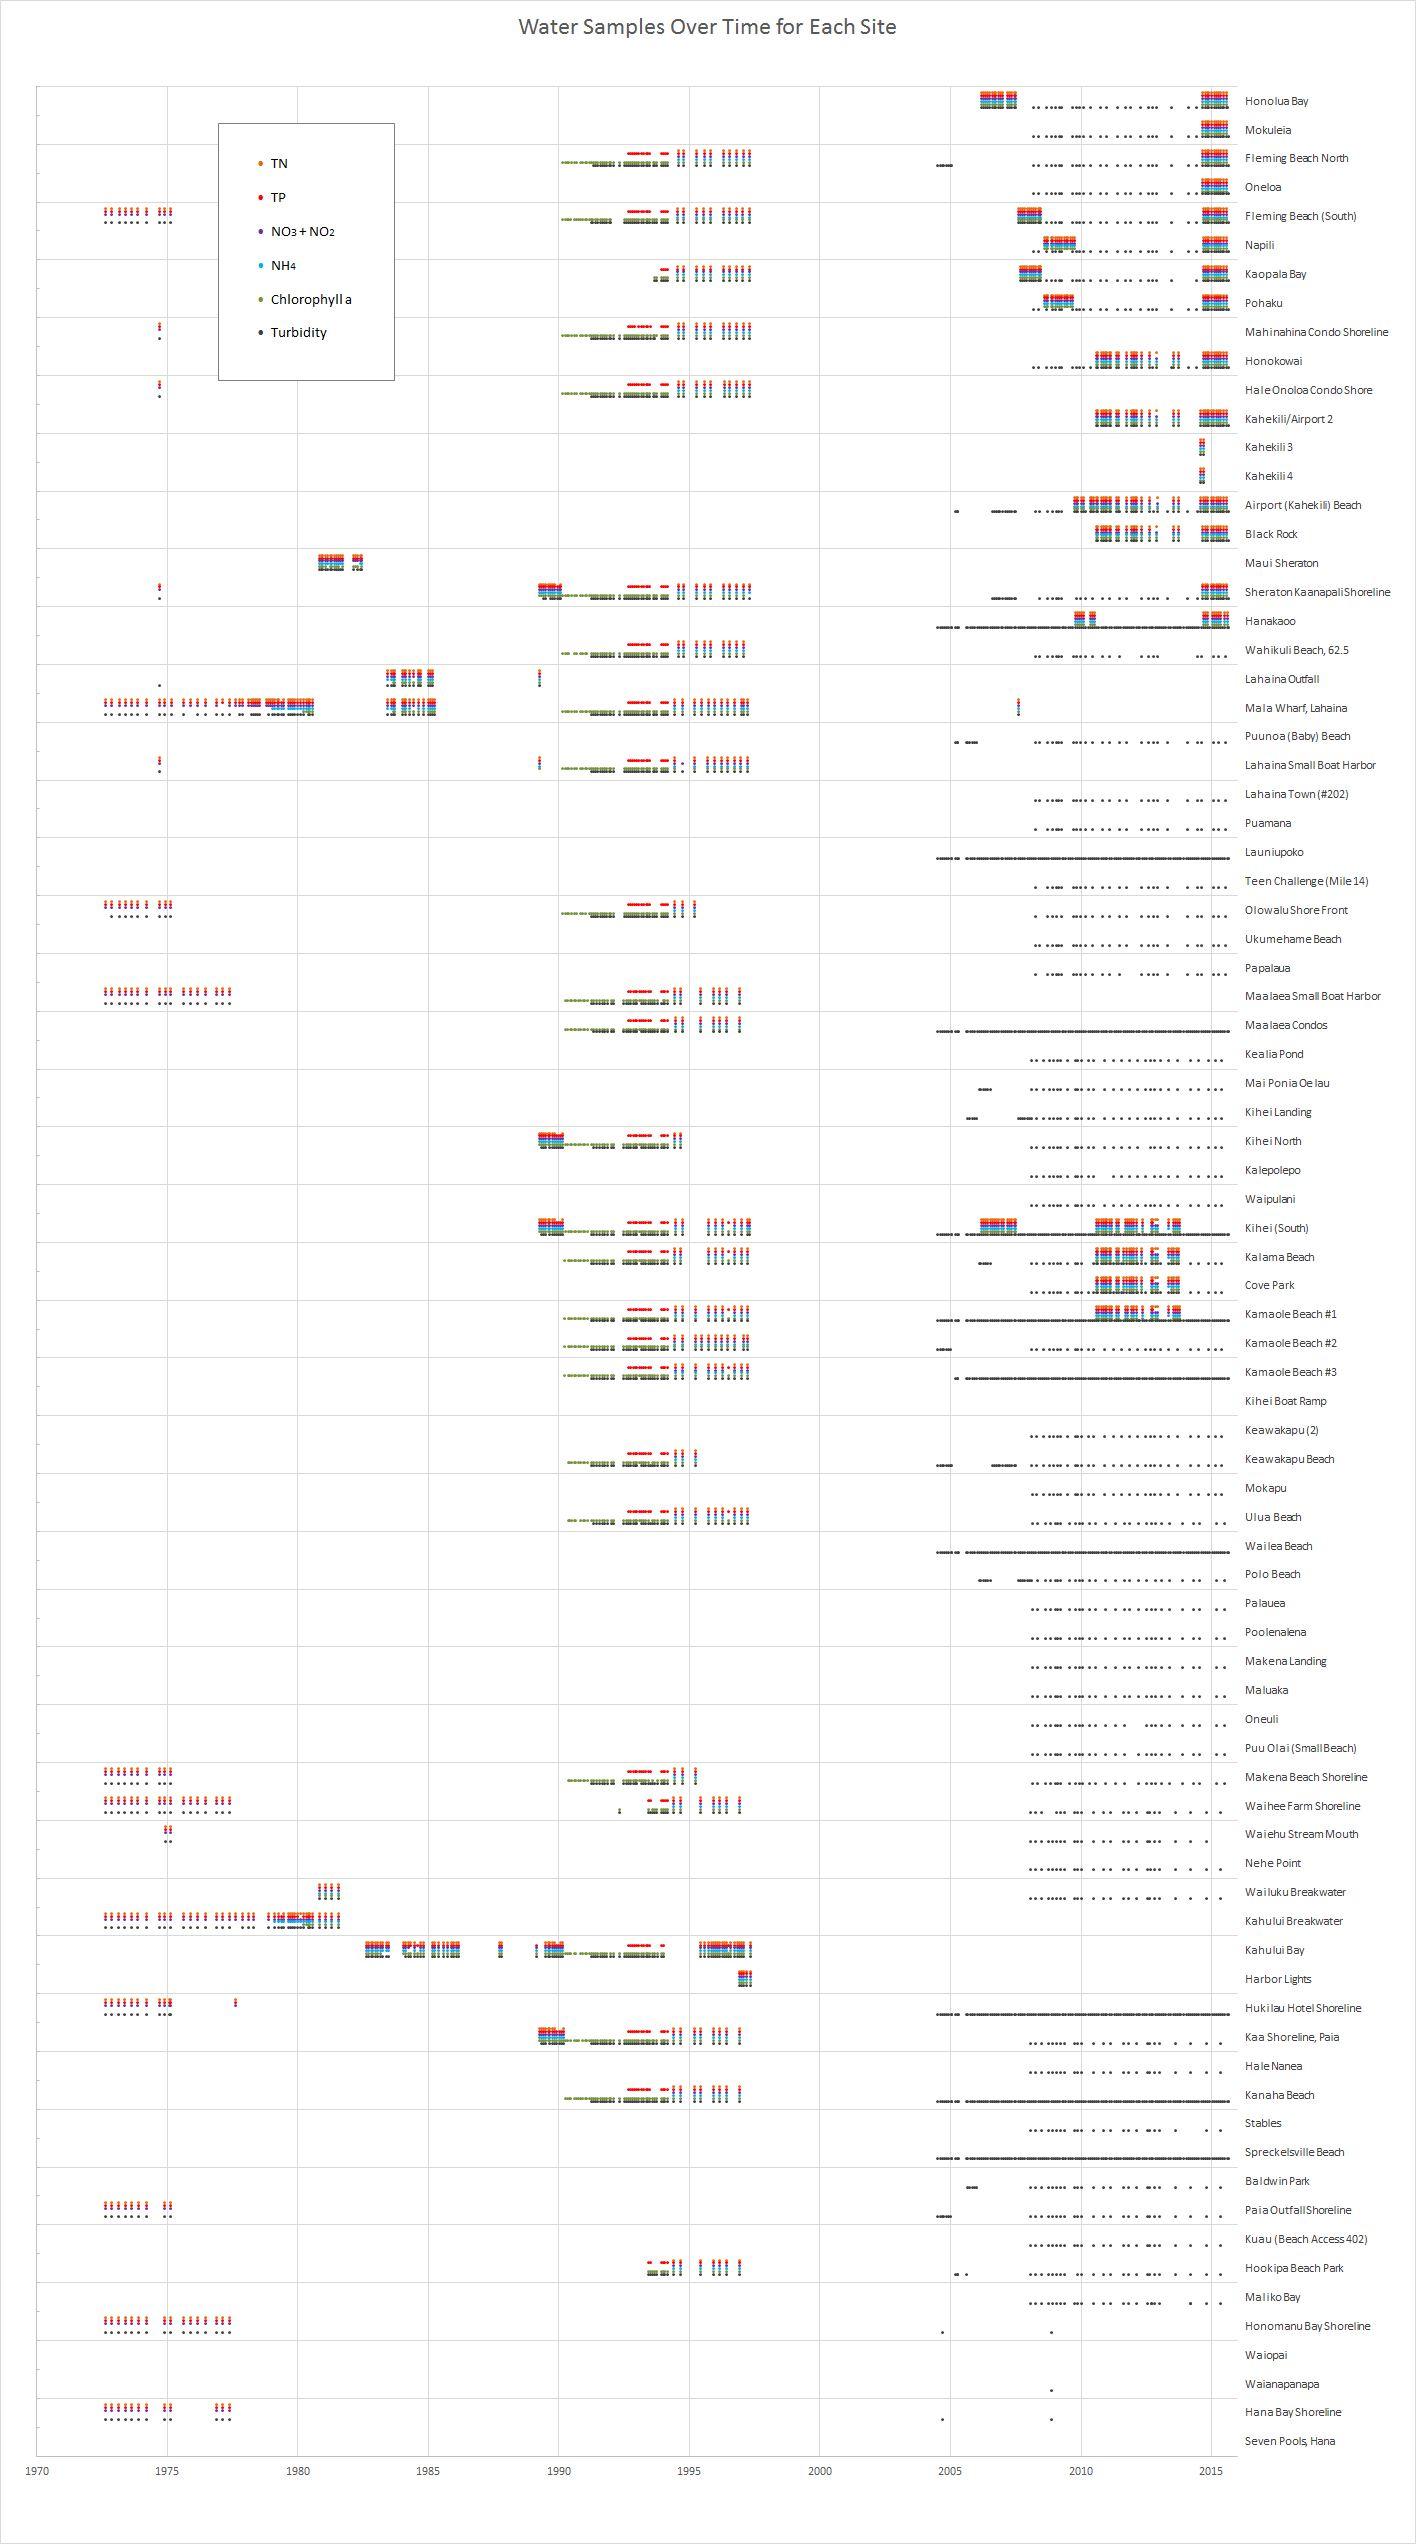
When and Where Samples were Taken
The following chart shows when each pollutant was measured at each site. Since relatively few sites have had comprehensive coverage in recent years it would be potentially misleading to compare them to sites with 10 or 20 year old data.